Architectural glazing company: same ad budget, 3.3× the leads
Custom glass partitions sold across the US. Forty customer interviews, real installations instead of renders, customer video instead of corporate ads and a form people could finish: paid leads went from ~$100 to ~$50 and inbound volume from 1,500 to 5,000 a month on the same budget.


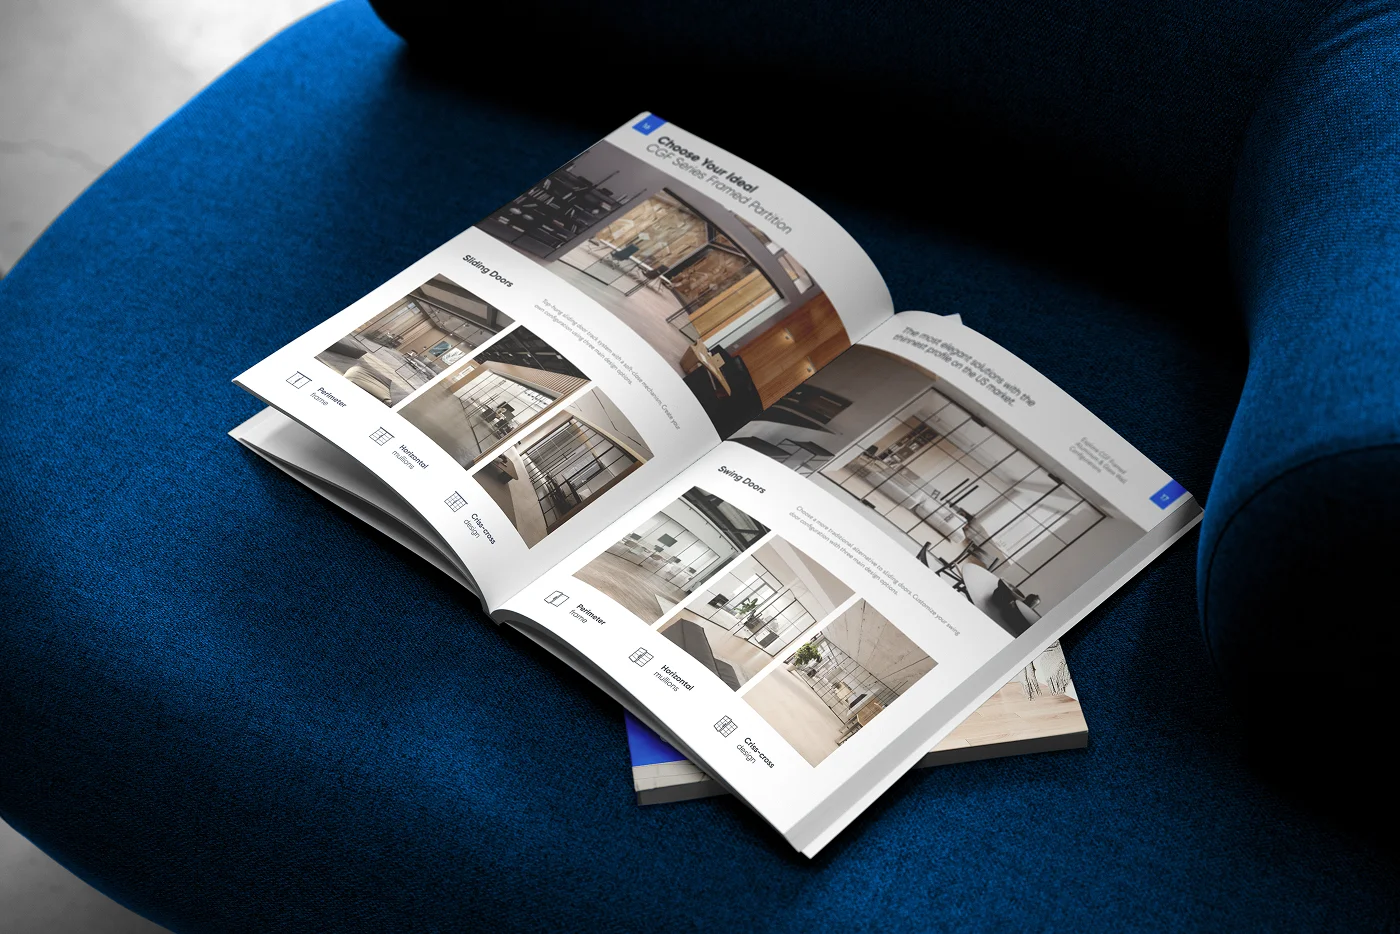
The client sells custom glass partitions across the United States. When we joined the company, an average paid lead cost roughly $100. Later, it was running at around $50.
The paid media budget had not meaningfully increased.
Meanwhile, total inbound volume grew from roughly 1,500 to 5,000 leads per month.
This was not achieved by discovering a secret Facebook checkbox. Unfortunately, those remain disappointingly rare.
The bigger change was understanding why people hesitated to buy in the first place — and removing as many of those reasons as possible.
We did something unfashionable: we asked customers
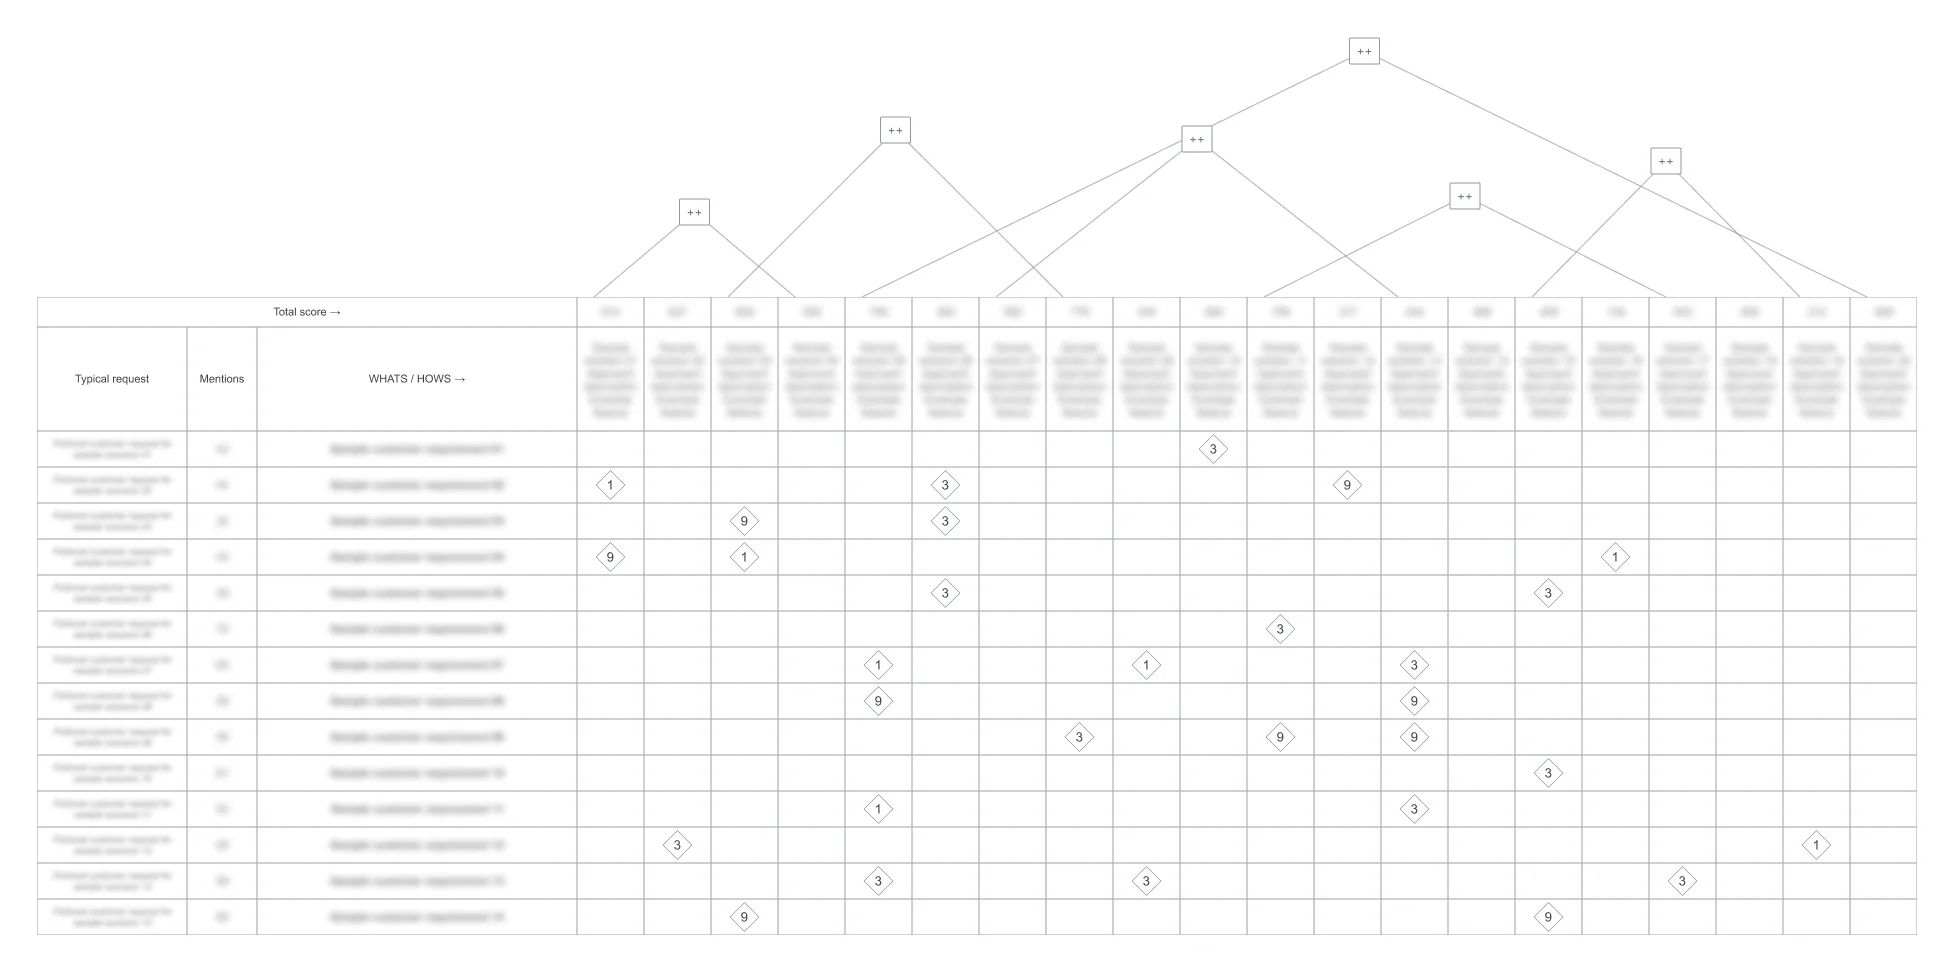
Before changing campaigns, we ran a full Quality Function Deployment study.
I conducted around 40 in-depth interviews across deliberately different groups:
The point was not to ask whether they “liked the brand”.
It was to understand what actually made buying difficult.
The interviews were turned into a full House of Quality, using the classic QFD methodology.
Which sounds like the sort of thing that should end with a 90-page PDF.
Instead, we used it to change the business.
Four reasons people hesitated
One person to deal with
Previously, a customer could be passed between several people as the project moved along.
Customers disliked this rather more than anybody inside the company had realised.
So we introduced the idea of a dedicated project manager: one person who stayed with the client throughout the project.
A remarkably simple improvement. Which is often what good research produces.
Real homes, not imaginary ones
The website relied heavily on beautiful 3D renders.
Perfect glass. Perfect furniture. Perfect lighting. Apparently nobody in these homes had ever owned a charging cable.
Customers wanted something less aspirational and considerably more useful:
What will this actually look like in a normal room?
So we began replacing polished renders with galleries of real installations in real apartments, houses and offices.
The work became slightly less perfect. And considerably more believable.
Help me measure the bloody thing
Another recurring concern was measurement.
Custom glass partitions are not something most homeowners order every Thursday.
People were worried they would measure incorrectly, receive an inaccurate quote and discover the mistake after several thousand dollars had already become involved.
So we created simple measurement guides and made the estimation process easier to understand.
This sounds like content marketing because technically it was.
In practice, it was mostly anxiety removal.
And who is going to install it?
This was the largest problem.
The company sold nationally, but did not have installation teams in every US state.
Customers liked the product.
They were rather less enthusiastic about receiving several hundred kilograms of custom glass and then discovering they needed to find somebody locally who knew what to do with it.
So the company began building and training a network of local installers across different states.
This wasn't an advertising optimisation.
It was a marketing problem solved by changing the actual service.
A useful reminder that sometimes the worst-performing part of your funnel is located nowhere near the funnel.
We made the advertising look less like advertising
The existing creative followed the traditional premium-product recipe: beautiful interiors, immaculate renders, polished copy and confident statements about quality, expertise and years in business.
All perfectly respectable.
And all unmistakably advertising.
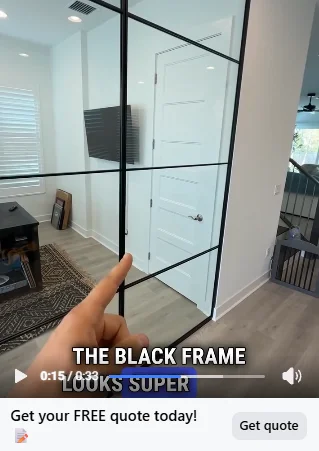
We began replacing much of it with real customer video.
Phones. Real homes. Real installations. Real people explaining what they had bought and what they thought of it.
The footage was often imperfect.
That was largely the point.
The audience trusted that more.
Conversion followed.
Sometimes lowering production value improves advertising value. Marketing is an irritating profession like that.

Then we turned the lead form into something people would actually finish
There was one unavoidable problem. The sales team genuinely needed a lot of information before producing an estimate.
Partition type, glass type, location, dimensions, property type and several other details.
So the website could not simply ask Name · Email · Phone and hope somebody else sorted out the difficult part later.
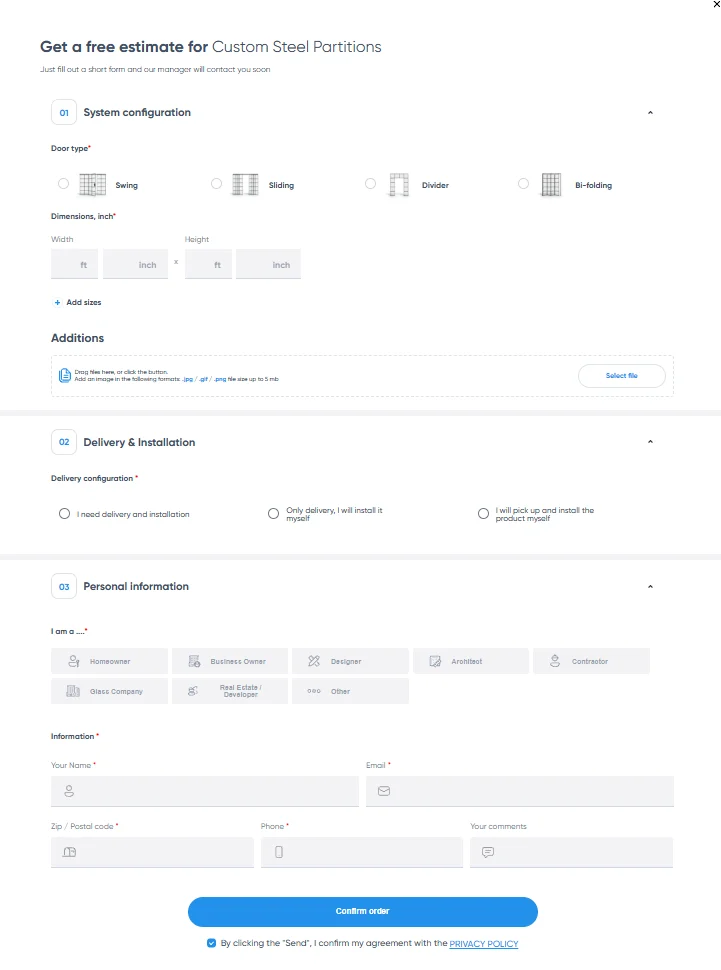
The original solution was a large form displaying a heroic collection of questions at once.
Technically complete.
Psychologically similar to applying for a mortgage.
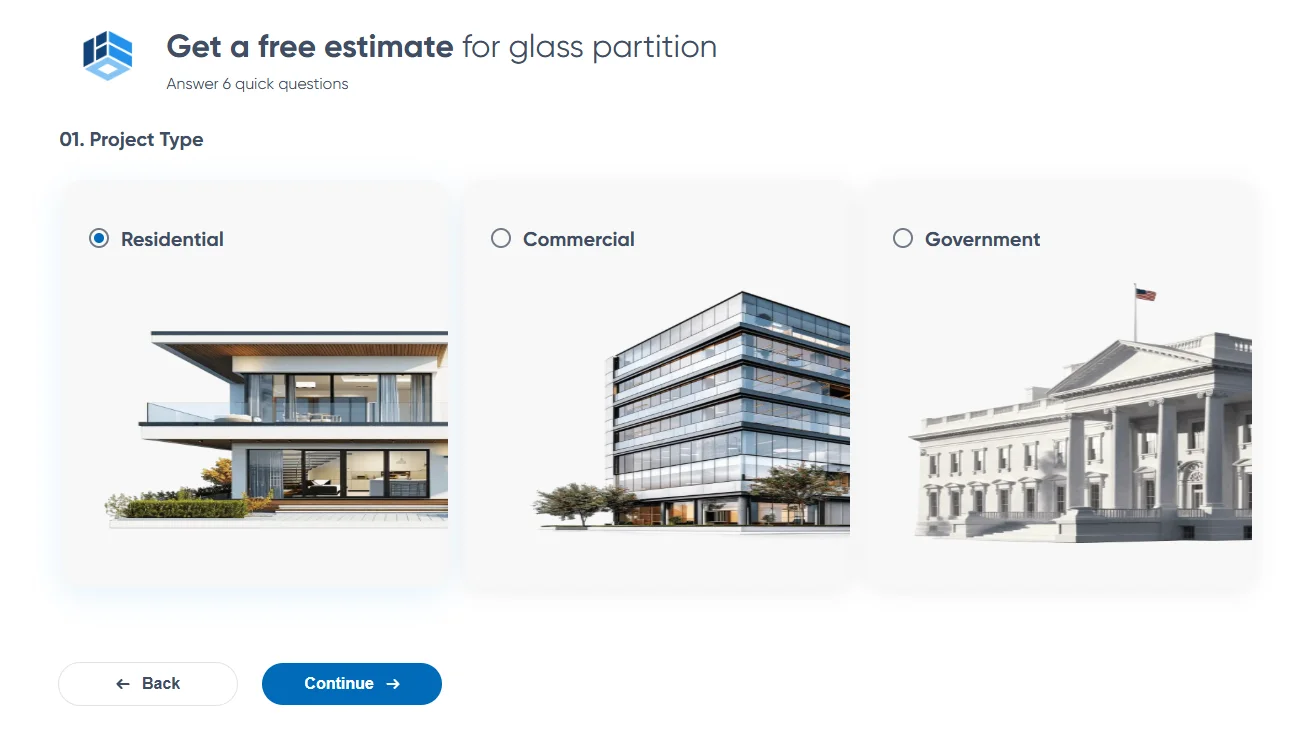
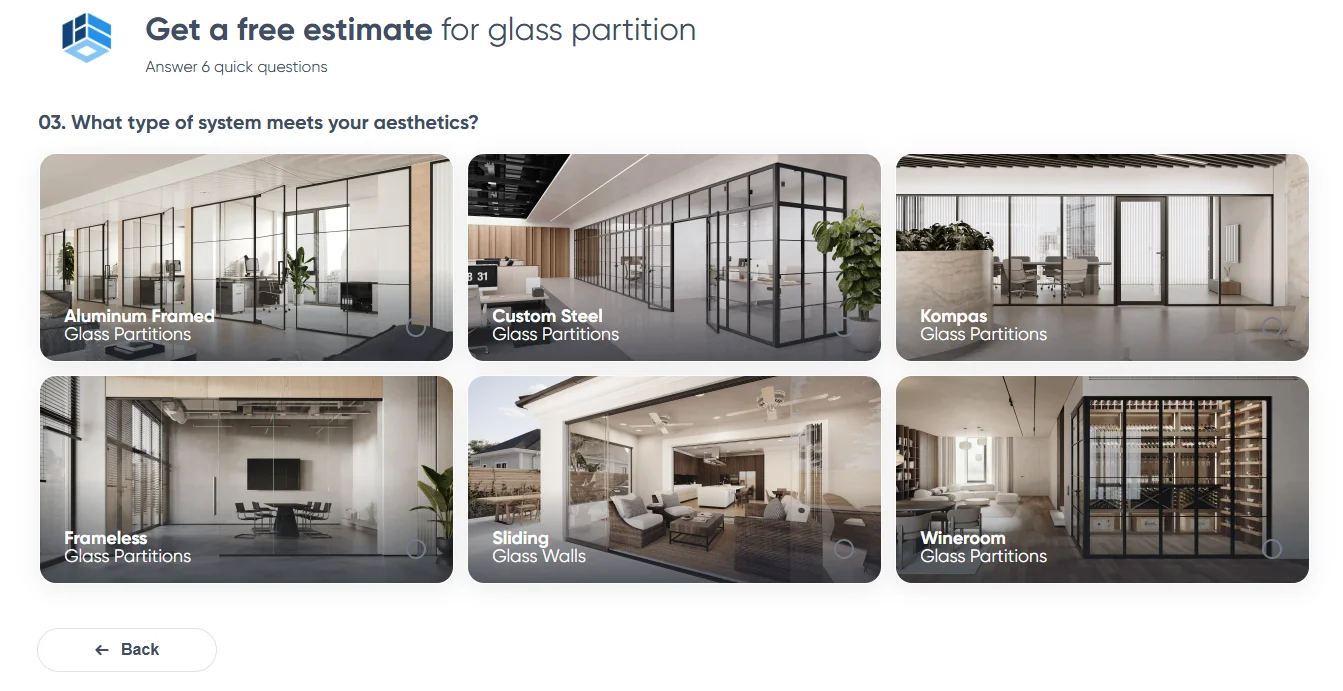
We replaced it with a multi-step form. One question at a time.
Choose the type. Next. Choose the space. Next. Enter dimensions. Next.
The same information was collected, but the experience felt closer to a short quiz than administrative punishment.
Our hypothesis was that reducing the apparent effort — and adding a small sense of progression — would increase completion.
It did.
Same basic request. Very different willingness to finish it.
The platform did not get more generous
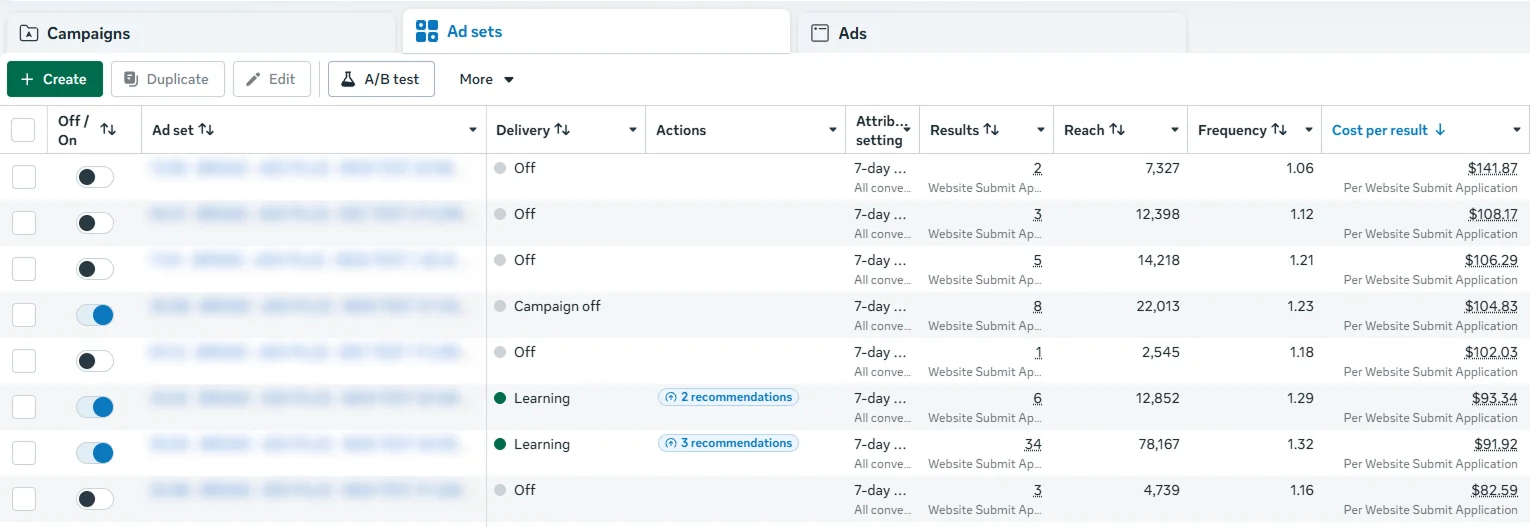
Before these changes, individual Meta campaigns and ad sets were regularly producing leads at around $90–$140+.
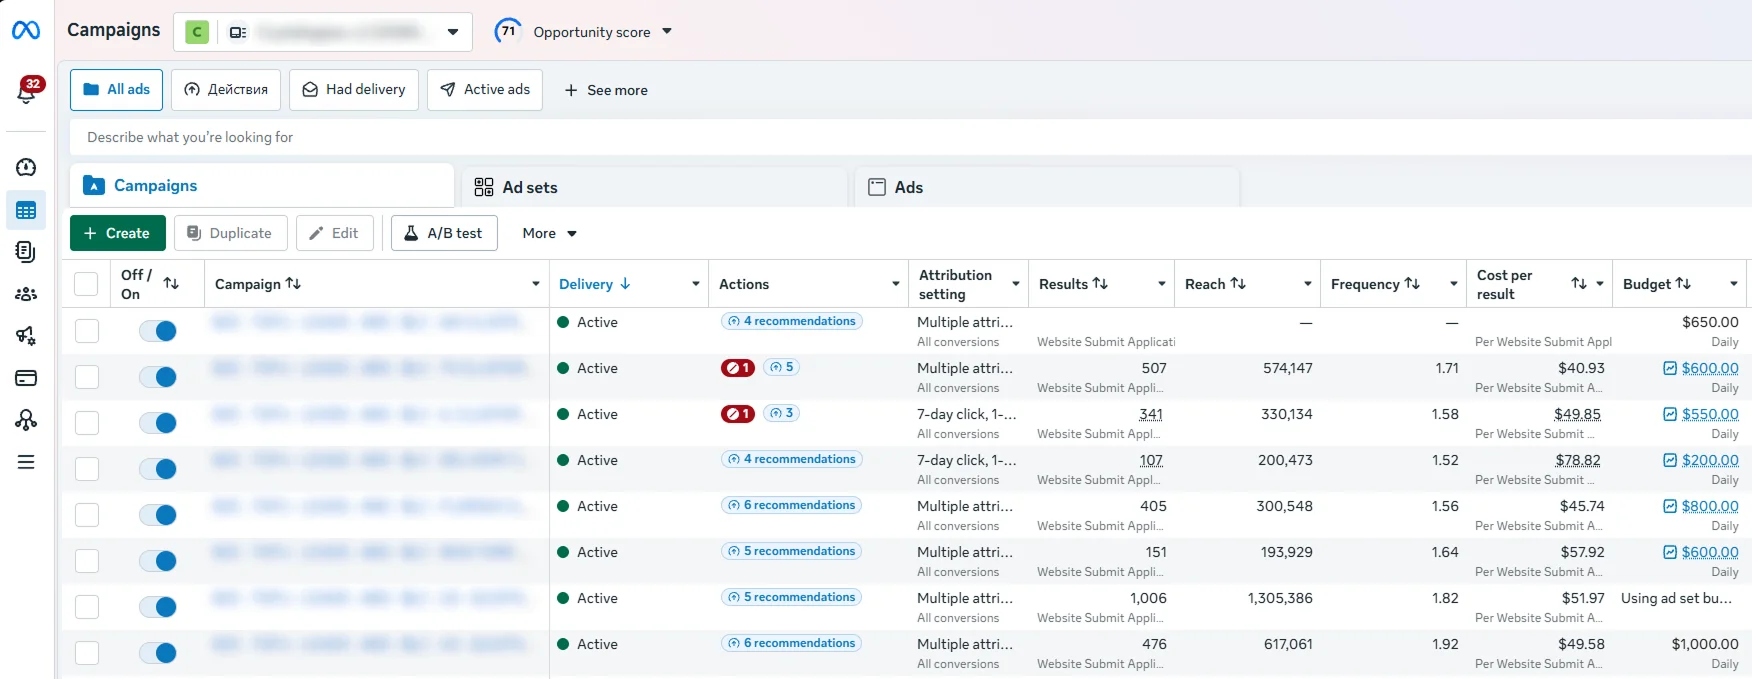
Later campaigns were consistently operating around $40–$60, with several large campaigns sitting close to the $50 mark.
The average cost of a paid lead effectively fell from roughly:
~$100~$50
And this happened without materially increasing the paid advertising budget.
The advertising platform had not suddenly become twice as generous.
The system around the traffic had become much better at turning attention into enquiries.
The economics of the whole system changed
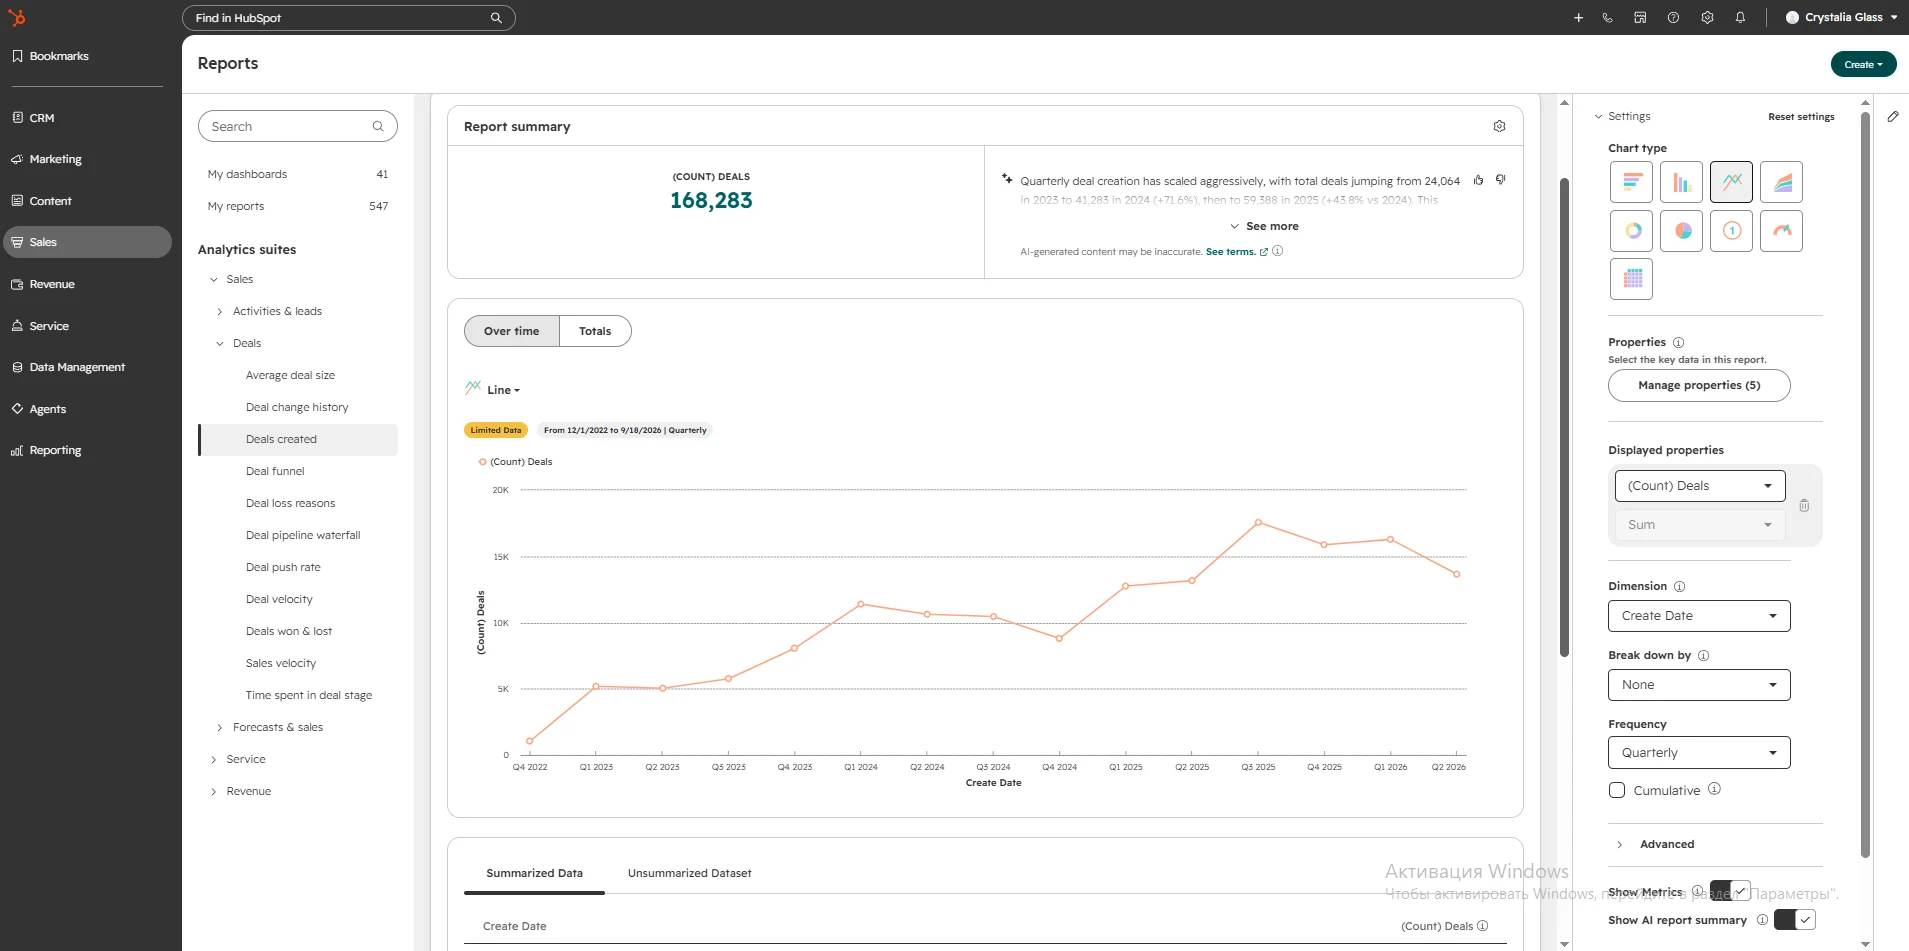
Over the same period, the company grew from approximately:
1,5005,000 inbound leads per month, while paid media spending remained broadly at the same level.
HubSpot data also shows the wider commercial system scaling substantially:
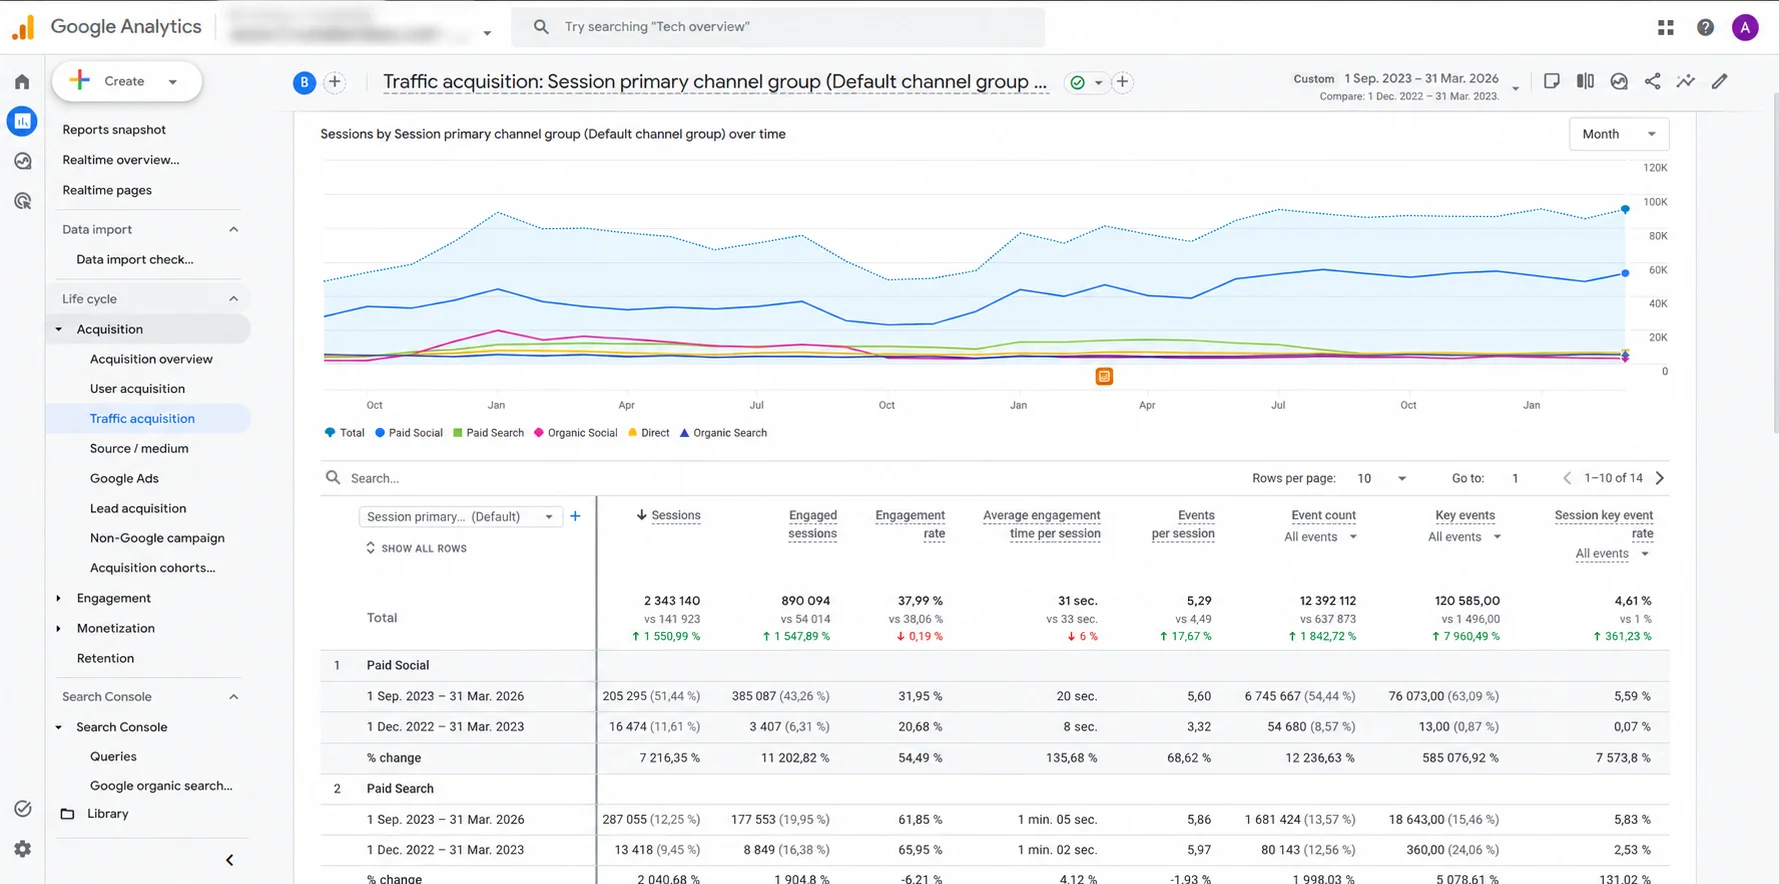
And Google Analytics shows traffic expanding dramatically across the same broader growth period.
The precise contribution of any individual change cannot honestly be isolated after the fact.
QFD did not produce 37.4% of the growth. UGC did not produce another 22.8%.
Anyone giving you numbers that precise is probably about to sell you an attribution platform.
What we can see is that the economics of the whole acquisition system changed.